
Statistics Canada
www.statcan.gc.ca
Common menu bar links
Environment

Archived Content
Information identified as archived is provided for reference, research or recordkeeping purposes. It is not subject to the Government of Canada Web Standards and has not been altered or updated since it was archived. Please contact us to request a format other than those available.
Tables
- Table 39 Materials prepared for recycling, by type, every two years
- Table 40 Household participation rates for selected environmental behaviours, by province, 2006
Charts
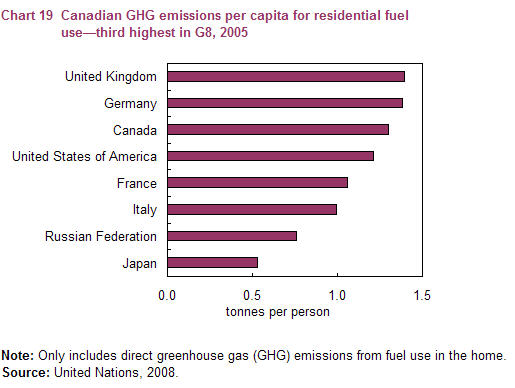
- Chart 19 Canadian greenhouse gas (GHG) emissions per capita for residential fuel use—third highest in G8, 2005
Map
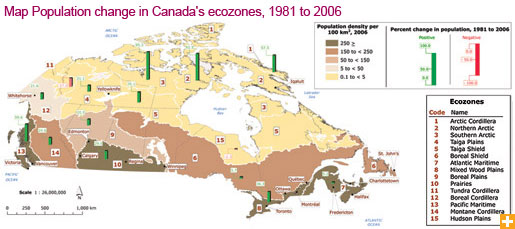
- Map 1 Population change in Canada’s ecozones, 1981 to 2006
View tables
| 2002 | 2004 | 2006 | |
|---|---|---|---|
| tonnes | |||
| Newsprint | 1,282,955 | 1,254,678 | 1,261,891 |
| Cardboard and boxboard | 1,122,304 | 1,322,774 | 1,471,315 |
| Mixed paper | 704,538 | 548,978 | 688,003 |
| Glass | 329,353 | 395,150 | 400,003 |
| Ferrous metals | 632,165 | 287,280 | 278,036 |
| Copper and aluminum | 41,583 | 49,476 | 51,225 |
| Mixed metals | 179,257 | 146,022 | 148,231 |
| White goods1 | .. | 236,683 | 299,397 |
| Electronics1 | .. | 10,245 | 11,357 |
| Plastics | 144,181 | 192,088 | 232,339 |
| Tires1 | .. | 136,386 | 138,646 |
| Construction, renovation and demolition |
645,931 | 848,197 | 715,364 |
| Organics | 1,310,790 | 1,519,601 | 2,006,461 |
| Other materials | 248,491 | 165,180 | 46,763 |
| .. not available for a specific period | |||
| 1. Data for this variable is available starting in the 2004 reference year. | |||
| Source: Statistics Canada, CANSIM, table 153-0043. | |||
| Low-flow showerhead | Reduced volume toilet | Compact fluorescent light bulbs | Composting | Recycling | Lowering temperatures | |
|---|---|---|---|---|---|---|
| percent1 | ||||||
| Canada | 56 | 37 | 59 | 30 | 97 | 54 |
| Newfoundland and Labrador | 58 | 27 | 53 | 23 | 94 | 62 |
| Prince Edward Island | 55 | 27 | 59 | 92 | 99 | 59 |
| Nova Scotia | 54 | 30 | 60 | 71 | 99 | 58 |
| New Brunswick | 55 | 31 | 61 | 37 | 96 | 48 |
| Quebec | 59 | 29 | 48 | 14 | 95 | 55 |
| Ontario | 60 | 43 | 65 | 38 | 98 | 51 |
| Manitoba | 46 | 35 | 50 | 23 | 88 | 50 |
| Saskatchewan | 37 | 34 | 53 | 29 | 96 | 63 |
| Alberta | 49 | 41 | 59 | 24 | 96 | 59 |
| British Columbia | 53 | 35 | 65 | 31 | 99 | 56 |
| 1. As a percentage of all households that have a thermostat and that have access to at least one recycling program. | ||||||
| Source: Statistics Canada, Households and the Environment Survey, 2006, Special tabulation. | ||||||
View charts
View Map
Source: Statistics Canada, Environment Accounts and Statistics Division.