Statistics Canada
www.statcan.gc.ca
Common menu bar links
Agriculture

Archived Content
Information identified as archived is provided for reference, research or recordkeeping purposes. It is not subject to the Government of Canada Web Standards and has not been altered or updated since it was archived. Please contact us to request a format other than those available.
Tables
- Table 28 Number of farms and area for selected countries and Census years
- Table 29 Number of farms and farm area, Canada and provinces, 2006 and 2001
- Table 30 Canadian farms by farm type, 2006 and 2001
- Table 31 Net farm income
- Table 32 Average operating revenue and expenses pet farm and operating margins, 2006
Charts
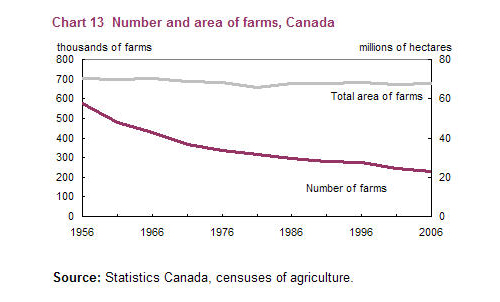
- Chart 13 Number and area of farms, Canada
View tables
| Farms | Total area of farms | Average size | |
|---|---|---|---|
| number | acres | ||
| Canada (2001) | 246,923 | 166,802,197 | 676 |
| Canada (2006) | 229,373 | 167,010,491 | 728 |
| Argentina (2002) | 295,485 | 425,273,427 | 1,439 |
| Australia (2001) | 140,516 | 1,126,091,533 | 8,014 |
| Brazil (1996) | 4,859,865 | 873,773,389 | 180 |
| China (1997) | 193,445,894 | 321,326,863 | 2 |
| France (2000) | 663,810 | 73,877,143 | 111 |
| United Kingdom (2000) | 233,250 | 40,839,774 | 175 |
| United States (2002) | 2,128,982 | 938,268,725 | 441 |
| Sources: FAO and Statistics Canada, Census of Agriculture, 2001 and 2006. | |||
| 2006 | 2001 | 2006 | 2001 | |
|---|---|---|---|---|
| number | total farm area (acres) | |||
| Canada | 229,373 | 246,923 | 167,010,491 | 166,802,197 |
| Newfoundland and Labrador | 558 | 643 | 89,441 | 100,271 |
| Prince Edward Island | 1,700 | 1,845 | 619,885 | 646,137 |
| Nova Scotia | 3,795 | 3,923 | 995,943 | 1,005,833 |
| New Brunswick | 2,776 | 3,034 | 976,629 | 958,899 |
| Quebec | 30,675 | 32,139 | 8,557,101 | 8,443,656 |
| Ontario | 57,211 | 59,728 | 13,310,216 | 13,507,357 |
| Manitoba | 19,054 | 21,071 | 19,073,005 | 18,784,407 |
| Saskatchewan | 44,329 | 50,598 | 64,253,845 | 64,903,830 |
| Alberta | 49,431 | 53,652 | 52,127,857 | 52,058,898 |
| British Columbia | 19,844 | 20,290 | 7,006,569 | 6,392,909 |
| Source: Statistics Canada, Census of Agriculture, 2001 and 2006. | ||||
| 2006 | 2001 | |||
|---|---|---|---|---|
| number | % of total farms | number | % of total farms | |
| All farms | 229,373 | 100.0 | 246,923 | 100.0 |
| Dairy | 14,651 | 6.4 | 18,321 | 7.4 |
| Beef | 60,947 | 26.6 | 67,838 | 27.5 |
| Hog and pig | 6,040 | 2.6 | 7,388 | 3.0 |
| Poultry and egg | 4,578 | 2.0 | 4,937 | 2.0 |
| All other animal production | 30,594 | 13.3 | 26,846 | 10.9 |
| Field crops | 91,277 | 39.8 | 101,041 | 40.9 |
| Fruit and vegetables | 12,532 | 5.5 | 11,663 | 4.7 |
| Greenhouse, nursery and floriculture |
8,754 | 3.8 | 8,889 | 3.6 |
| Source: Statistics Canada, Census of Agriculture, 2001 and 2006. | ||||
| 1987 | 1997 | 2007 | |
|---|---|---|---|
| $ millions | |||
| Gross income | 21,177 | 29,021 | 39,774 |
| Total farm cash receipts including payments |
21,346 | 29,836 | 40,691 |
| Income in kind | 120 | 54 | 41 |
| Value of inventory change | -288 | -868 | -958 |
| Operating expenses and depreciation charges | 18,099 | 27,456 | 38,575 |
| Operating expenses after rebates | 15,387 | 23,511 | 33,567 |
| Depreciation charges | 2,712 | 3,945 | 5,008 |
| Total net income | 3,078 | 1,565 | 1,199 |
| Source: Statistics Canada, CANSIM, table 002-0009. | |||
| Average operating revenues | Average operating expenses | Operating margins1 | |
|---|---|---|---|
| dollars | cents | ||
| All farms | 242,928 | 212,274 | 12.6 |
| Grain and oilseed | 163,766 | 135,740 | 17.1 |
| Potato | 771,448 | 653,712 | 15.3 |
| Other vegetable and melon | 375,630 | 319,075 | 15.1 |
| Fruit and tree nut | 181,866 | 153,937 | 15.4 |
| Greenhouse, nursery and floriculture |
902,752 | 812,471 | 10.0 |
| Other crop | 99,382 | 82,438 | 17.0 |
| Beef cattle and feedlots | 190,486 | 181,242 | 4.9 |
| Dairy and milk production | 403,114 | 307,232 | 23.8 |
| Hog and pig | 958,250 | 898,357 | 6.3 |
| Poultry and egg | 835,889 | 731,708 | 12.5 |
| Other animal | 173,482 | 154,748 | 10.8 |
| Notes: Final data. Final estimates include unincorporated farms with total operating revenues of $10,000 and over, and incorporated farms with total operating revenues of $25,000 and over; they exclude communal farming organizations. |
|||
| 1. Defined as one dollar minus operating expenses (before depreciation) per dollar of revenue. | |||
| Source: Statistics Canada, Catalogue no. 21-208-XIE. | |||