Statistics Canada
www.statcan.gc.ca
Common menu bar links
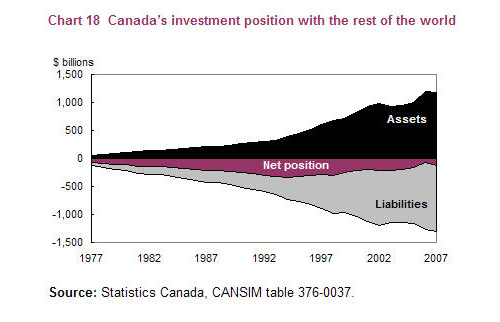
Chart 18 (data) Canada's investment position with the rest of the world

Archived Content
Information identified as archived is provided for reference, research or recordkeeping purposes. It is not subject to the Government of Canada Web Standards and has not been altered or updated since it was archived. Please contact us to request a format other than those available.
| Year | Assets | Liabilities (represented as negative for the chart) | Net position |
|---|---|---|---|
| $ millions | |||
| 1977 | 61,407 | -130,063 | -68,656 |
| 1978 | 75,647 | -163,751 | -88,104 |
| 1979 | 85,228 | -188,382 | -103,154 |
| 1980 | 110,306 | -220,583 | -110,277 |
| 1981 | 130,766 | -266,503 | -135,738 |
| 1982 | 140,248 | -276,849 | -136,601 |
| 1983 | 146,170 | -290,487 | -144,317 |
| 1984 | 164,998 | -319,403 | -154,405 |
| 1985 | 181,357 | -359,190 | -177,833 |
| 1986 | 201,794 | -398,610 | -196,816 |
| 1987 | 212,863 | -425,436 | -212,572 |
| 1988 | 220,272 | -436,178 | -215,905 |
| 1989 | 237,995 | -470,056 | -232,061 |
| 1990 | 263,922 | -516,428 | -252,506 |
| 1991 | 281,902 | -549,310 | -267,408 |
| 1992 | 298,521 | -596,636 | -298,114 |
| 1993 | 326,268 | -650,007 | -323,739 |
| 1994 | 396,900 | -729,981 | -333,081 |
| 1995 | 443,266 | -767,455 | -324,189 |
| 1996 | 509,132 | -820,501 | -311,370 |
| 1997 | 599,483 | -889,707 | -290,224 |
| 1998 | 686,347 | -986,008 | -299,661 |
| 1999 | 717,346 | -961,024 | -243,677 |
| 2000 | 827,578 | -1,036,415 | -208,837 |
| 2001 | 921,976 | -1,125,414 | -203,437 |
| 2002 | 979,184 | -1,187,876 | -208,692 |
| 2003 | 921,148 | -1,137,847 | -216,699 |
| 2004 | 952,790 | -1,143,215 | -190,425 |
| 2005 | 999,784 | -1,159,245 | -159,461 |
| 2006 | 1,191,911 | -1,269,214 | -77,303 |
| 2007 | 1,184,382 | -1,309,392 | -125,010 |
| Source: Statistics Canada, CANSIM table 376-0037. | |||