Statistics Canada
www.statcan.gc.ca
Common menu bar links
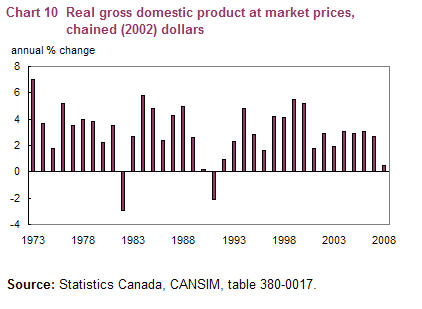
Chart 10 (data) Real gross domestic product at market prices, chained (2002) dollars

Archived Content
Information identified as archived is provided for reference, research or recordkeeping purposes. It is not subject to the Government of Canada Web Standards and has not been altered or updated since it was archived. Please contact us to request a format other than those available.
| Year | Annual change |
|---|---|
| % | |
| 1973 | 7.0 |
| 1974 | 3.7 |
| 1975 | 1.8 |
| 1976 | 5.2 |
| 1977 | 3.5 |
| 1978 | 4.0 |
| 1979 | 3.8 |
| 1980 | 2.2 |
| 1981 | 3.5 |
| 1982 | -2.9 |
| 1983 | 2.7 |
| 1984 | 5.8 |
| 1985 | 4.8 |
| 1986 | 2.4 |
| 1987 | 4.3 |
| 1988 | 5.0 |
| 1989 | 2.6 |
| 1990 | 0.2 |
| 1991 | -2.1 |
| 1992 | 0.9 |
| 1993 | 2.3 |
| 1994 | 4.8 |
| 1995 | 2.8 |
| 1996 | 1.6 |
| 1997 | 4.2 |
| 1998 | 4.1 |
| 1999 | 5.5 |
| 2000 | 5.2 |
| 2001 | 1.8 |
| 2002 | 2.9 |
| 2003 | 1.9 |
| 2004 | 3.1 |
| 2005 | 2.9 |
| 2006 | 3.1 |
| 2007 | 2.7 |
| 2008 | 0.5 |
| Source: Statistics Canada, CANSIM, table 380-0017. | |