Common menu bar links
Finance
Archived Content
Information identified as archived is provided for reference, research or recordkeeping purposes. It is not subject to the Government of Canada Web Standards and has not been altered or updated since it was archived. Please contact us to request a format other than those available.

Tables
- Table 43 International transactions in securities
- Table 44 Federal general government revenue and expenditures, 2005/2006
Chart
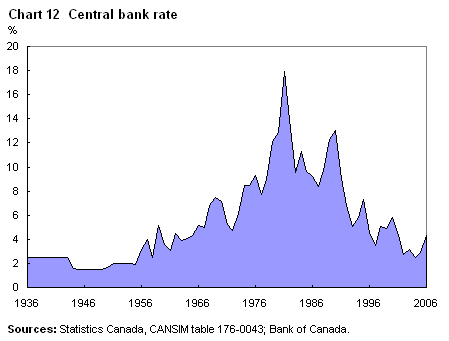
- Chart 12 Central bank rate
Tables
| 1985 | 1995 | 2005 | |
|---|---|---|---|
| $ millions | |||
| Canadian portfolio investments | 19,194 | 90,768 | 284,604 |
| Foreign bonds | 5,146 | 18,822 | 82,374 |
| Foreign stocks | 14,048 | 71,946 | 189,175 |
| Foreign money market1 | .. | .. | 13,055 |
| Foreign portfolio investments | 138,346 | 422,903 | 508,398 |
| Canadian bonds | 117,668 | 341,698 | 380,017 |
| Canadian stocks | 15,134 | 37,092 | 107,598 |
| Canadian money market | 5,543 | 44,113 | 20,783 |
| .. not available for a specific reference period | |||
| 1. Introduced in 2002. | |||
| Source: Statistics Canada, CANSIM table 376-0037. | |||
| $ millions | % of total | |
|---|---|---|
| Total revenue | 224,607 | 100.0 |
| Income taxes | 144,562 | 64.4 |
| Consumption taxes | 48,490 | 21.6 |
| Other taxes | 670 | 0.3 |
| Contributions to social security plans | 17,527 | 7.8 |
| Sales of goods and services | 6,016 | 2.7 |
| Investment income | 6,096 | 2.7 |
| Other revenue from own sources | 553 | 0.2 |
| General purpose transfers | 603 | 0.3 |
| Specific purpose transfers | 88 | 0.0 |
| Total expenditures | 211,103 | 100.0 |
| General government services | 9,059 | 4.3 |
| Protection of persons and property | 24,275 | 11.5 |
| Transportation and communications | 2,266 | 1.1 |
| Health | 21,531 | 10.2 |
| Social services | 64,577 | 30.6 |
| Education | 4,937 | 2.3 |
| Resource conservation and industrial development | 8,206 | 3.9 |
| Environment | 2,100 | 1.0 |
| Recreation and culture | 4,044 | 1.9 |
| Labour, employment and immigration | 1,857 | 0.9 |
| Housing | 2,033 | 1.0 |
| Foreign affairs and international assistance | 6,065 | 2.9 |
| Regional planning and development | 339 | 0.2 |
| Research establishments | 3,013 | 1.4 |
| General purpose transfers | 24,785 | 11.7 |
| Debt charges | 32,004 | 15.2 |
| Other expenditures | 14 | 0.0 |
| Surplus | 13,504 | |
| Net federal debt1 | 514,089 | |
| 1. As of March 31, 2006. | ||
| Source: Statistics Canada, CANSIM tables 385-0002 and 385-0010. | ||


