Common menu bar links
Demography
Archived Content
Information identified as archived is provided for reference, research or recordkeeping purposes. It is not subject to the Government of Canada Web Standards and has not been altered or updated since it was archived. Please contact us to request a format other than those available.

Tables
- Table 1 Population of Canada, provinces and territories
- Table 2 Population of major census metropolitan areas
- Table 3 Census families
- Table 4 Main components of population growth
- Table 5 Aboriginal identity population, by age group, 2006
- Table 6 Religions in Canada, 2001
- Table 7 Mother tongue of Canadians
Charts
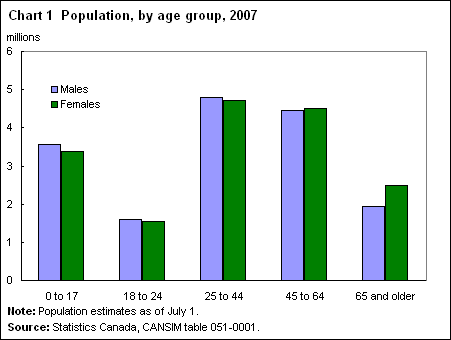
- Chart 1 Population, by age group, 2007
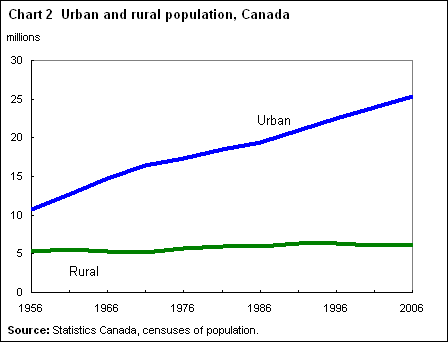
- Chart 2 Urban and rural population, Canada
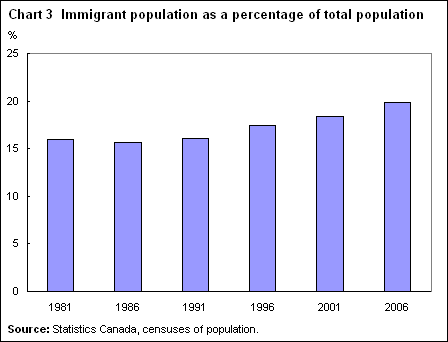
- Chart 3 Immigrant population as a percentage of total population
Tables
| 1992 | 2002 | 2007 | |
|---|---|---|---|
| number | |||
| Canada | 28,366,737 | 31,372,587 | 32,976,026 |
| Newfoundland and Labrador | 580,029 | 519,449 | 506,275 |
| Prince Edward Island | 130,778 | 136,934 | 138,627 |
| Nova Scotia | 919,571 | 934,507 | 934,147 |
| New Brunswick | 748,103 | 750,327 | 749,782 |
| Quebec | 7,108,000 | 7,445,745 | 7,700,807 |
| Ontario | 10,569,806 | 12,102,045 | 12,803,861 |
| Manitoba | 1,112,696 | 1,155,584 | 1,186,679 |
| Saskatchewan | 1,003,956 | 995,886 | 996,869 |
| Alberta | 2,632,907 | 3,116,332 | 3,473,984 |
| British Columbia | 3,468,445 | 4,115,413 | 4,380,256 |
| Yukon | 30,112 | 30,137 | 30,989 |
| Northwest Territories | 39,431 | 41,489 | 42,637 |
| Nunavut | 22,903 | 28,739 | 31,113 |
| Note: Population estimates as of July 1. | |||
| Source: Statistics Canada, CANSIM table 051-0001. | |||
| 1997 | 2002 | 2007 | |
|---|---|---|---|
| number | |||
| Toronto | 4,481,807 | 5,020,447 | 5,509,874 |
| Montréal | 3,395,142 | 3,547,112 | 3,695,790 |
| Vancouver | 1,958,228 | 2,111,305 | 2,285,893 |
| Ottawa-Gatineau1 | 1,030,052 | 1,118,819 | 1,168,788 |
| Calgary | 871,765 | 1,002,030 | 1,139,126 |
| Edmonton | 896,690 | 979,907 | 1,081,275 |
| Québec | 686,043 | 701,564 | 728,924 |
| Hamilton | 651,288 | 697,891 | 720,426 |
| Winnipeg | 678,020 | 693,685 | 712,671 |
| London | 431,870 | 454,514 | 469,714 |
| Notes: Some figures have
been adjusted because of boundary changes. Population estimates as of July 1, based on 2001 Census boundaries. |
|||
| 1. Formerly Ottawa-Hull. | |||
| Source: Statistics Canada, CANSIM table 051-0034. | |||
| 1986 | 1996 | 2006 | |
|---|---|---|---|
| number | |||
| All families | 6,733,845 | 7,837,865 | 8,896,840 |
| Families of married couples | 5,398,220 | 5,779,720 | 6,105,910 |
| Families of common law couples | 482,330 | 920,635 | 1,376,870 |
| Lone-parent families | 853,300 | 1,137,505 | 1,414,060 |
| Male lone-parent families | 151,485 | 192,275 | 281,775 |
| Female lone-parent families | 701,815 | 945,235 | 1,132,290 |
| Note: Historical comparisons for census families, particularly lone-parent families, must be interpreted with caution due to conceptual changes in 2001. | |||
| Source: Statistics Canada, Catalogue nos. 93F0022XDB and 97-553-XIE. | |||
| 1986/1987 | 1996/1997 | 2006/2007p | |
|---|---|---|---|
| number | |||
| Births | 373,022 | 357,313 | 352,848 |
| Deaths | 182,599 | 217,221 | 237,931 |
| Immigration | 130,880 | 224,857 | 238,127 |
| Emigration | 47,707 | 52,815 | 41,349 |
| p preliminary | |||
| Note: All figures are for the one-year period ending June 30. | |||
| Source: Statistics Canada, CANSIM table 051-0004. | |||
| Total | 0 to 24 | 25 and older | |
|---|---|---|---|
| number | |||
| Canada | 1,172,785 | 560,910 | 611,875 |
| Newfoundland and Labrador | 23,455 | 9,620 | 13,835 |
| Prince Edward Island | 1,730 | 875 | 855 |
| Nova Scotia | 24,175 | 10,640 | 13,535 |
| New Brunswick | 17,650 | 7,385 | 10,265 |
| Quebec | 108,425 | 45,305 | 63,120 |
| Ontario | 242,495 | 105,205 | 137,290 |
| Manitoba | 175,395 | 90,355 | 85,040 |
| Saskatchewan | 141,890 | 78,685 | 63,205 |
| Alberta | 188,365 | 94,820 | 93,545 |
| British Columbia | 196,075 | 90,065 | 106,010 |
| Yukon | 7,580 | 3,315 | 4,265 |
| Northwest Territories | 20,635 | 10,045 | 10,590 |
| Nunavut | 24,915 | 14,600 | 10,315 |
| Note: Aboriginal identity refers to those persons who reported identifying with at least one Aboriginal group, that is, North American Indian, Métis or Inuit, and/or those who reported being a Treaty Indian or a Registered Indian, as defined by the Indian Act of Canada, and/or those who reported they were members of an Indian band or First Nation. | |||
| Source: Statistics Canada, 2006 Census of Population. | |||
| Number | % | |
|---|---|---|
| Total population1 | 29,639,035 | 100.0 |
| Catholic | 12,936,905 | 43.6 |
| Protestant | 8,654,850 | 29.2 |
| Christian Orthodox | 479,620 | 1.6 |
| Christian not included elsewhere | 780,450 | 2.6 |
| Muslim | 579,640 | 2.0 |
| Jewish | 329,995 | 1.1 |
| Buddhist | 300,345 | 1.0 |
| Hindu | 297,200 | 1.0 |
| Sikh | 278,410 | 0.9 |
| Eastern religions | 37,550 | 0.1 |
| Other religions | 63,975 | 0.2 |
| No religious affiliation | 4,900,090 | 16.5 |
| 1. Based on 20% census sample data. | ||
| Source: Statistics Canada, 2001 Census of Population. | ||
| 1996 | 2001 | 2006 | |
|---|---|---|---|
| number | |||
| Total population1 | 28,528,125 | 29,639,030 | 31,241,030 |
| Single responses | 28,125,565 | 29,257,890 | 30,848,270 |
| English | 16,890,620 | 17,352,315 | 17,882,775 |
| French | 6,636,660 | 6,703,325 | 6,817,655 |
| Chinese2 | 715,640 | 853,750 | 1,012,065 |
| Italian | 484,500 | 469,485 | 455,040 |
| German | 450,140 | 438,080 | 450,570 |
| Punjabi | 201,780 | 271,220 | 367,505 |
| Spanish | 212,890 | 245,500 | 345,345 |
| Arabic | 148,555 | 199,940 | 261,640 |
| Tagalog (Pilipino) | 133,210 | 174,060 | 235,615 |
| Portuguese | 211,290 | 213,810 | 219,275 |
| Polish | 213,415 | 208,370 | 211,175 |
| Aboriginal languages | 186,935 | 187,670 | 210,075 |
| Urdu | 39,770 | 80,890 | 145,805 |
| Vietnamese | 106,515 | 122,055 | 141,630 |
| Ukrainian | 162,695 | 148,085 | 134,500 |
| Persian (Farsi) | 60,280 | 94,090 | 134,080 |
| Other single responses | 1,270,670 | 1,495,245 | 1,823,520 |
| Multiple responses | 402,560 | 381,145 | 392,760 |
| Note: Refers to the first language learned at home in childhood and still understood by the individual at the time of the census. | |||
| 1. Based on 20% census sample data. | |||
| 2. Includes Cantonese, Mandarin, Hakka and other Chinese languages. | |||
| Source: Statistics Canada, censuses of population. | |||


