
Statistics Canada
www.statcan.gc.ca
Home > Publications > Canada at a Glance 2008
>
-
Canada at a Glance 2008
Product information
Page content follows
Agriculture
 View the most recent version.
Archived Content
Information identified as archived is provided for reference, research or recordkeeping purposes. It is not subject to the Government of Canada Web Standards and has not been altered or updated since it was archived. Please contact us to request a format other than those available.

Tables
- Table 34 Average farm size
- Table 35 Farm population
- Table 36 Operating arrangements of farms, 2006
- Table 37 Net farm income
- Table 38 Average operating revenues and expenses per farm
and operating margins, 2006
Chart
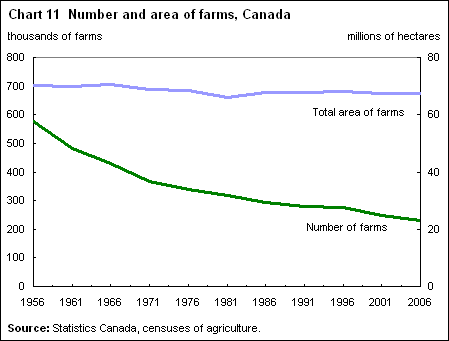
- Chart 11 Number and area of farms, Canada
Tables
Table 34 Average farm size
| |
hectares |
| Canada |
122 |
207 |
295 |
| Newfoundland and
Labrador |
12 |
49 |
65 |
| Prince
Edward Island |
46 |
90 |
148 |
| Nova
Scotia |
53 |
92 |
106 |
| New
Brunswick |
55 |
108 |
142 |
| Quebec |
53 |
78 |
113 |
| Ontario |
57 |
73 |
94 |
| Manitoba |
147 |
259 |
405 |
| Saskatchewan |
246 |
385 |
587 |
| Alberta |
234 |
329 |
427 |
| British
Columbia |
74 |
109 |
143 |
Table 35 Farm population
| |
number |
| Total population1 |
10,363,240 |
18,200,621 |
29,914,315 |
| Total
farm population1 |
3,289,140 |
2,128,327 |
727,125 |
| |
% |
| Farm
population as a percentage of total population |
31.7 |
11.7 |
2.4 |
Table 36 Operating arrangements of farms, 2006
| Total number
of farms |
229,373 |
100.0 |
| Sole proprietorship |
130,864 |
57.1 |
| Partnership
without a written agreement |
48,430 |
21.1 |
| Partnership
with a written agreement |
12,745 |
5.6 |
| Family
corporation |
32,278 |
14.1 |
| Non-family
corporation |
4,339 |
1.9 |
| Other |
717 |
0.3 |
Table 37 Net farm income
| |
$ millions |
| Gross
income |
21,415 |
30,571 |
36,154 |
| Total
farm cash receipts including payments |
20,631 |
29,075 |
36,884 |
| Income
in kind |
142 |
168 |
119 |
| Value
of inventory change |
642 |
1,328 |
-849 |
| Operating
expenses and depreciation charges |
17,847 |
26,752 |
36,159 |
| Operating
expenses after rebates |
15,097 |
23,021 |
31,568 |
| Depreciation
charges |
2,750 |
3,731 |
4,591 |
| Total
net income |
3,568 |
3,819 |
-6 |
Table 38 Average operating revenues and expenses per farm and operating margins,
2006
| |
dollars |
cents |
| All farms |
235,248 |
205,942 |
12.5 |
| Grain
and oilseed |
161,173 |
133,609 |
17.1 |
| Potato |
767,234 |
645,191 |
15.9 |
| Other
vegetable and melon |
382,482 |
323,864 |
15.3 |
| Fruit
and tree nut |
185,561 |
156,724 |
15.5 |
| Greenhouse,
nursery and floriculture |
916,414 |
828,221 |
9.6 |
| Other
crop |
96,260 |
79,892 |
17.0 |
| Beef
cattle and feedlots |
189,759 |
180,866 |
4.7 |
| Dairy
and milk production |
404,827 |
307,529 |
24.0 |
| Hog
and pig |
881,128 |
830,130 |
5.8 |
| Poultry
and egg |
828,097 |
725,003 |
12.4 |
| Other
animal |
101,333 |
97,958 |
3.3 |
Chart
View data source