
Statistics Canada
www.statcan.gc.ca
Home > Publications > Canada at a Glance 2008
>
-
Canada at a Glance 2008
Product information
Page content follows
Economy
 View the most recent version.
Archived Content
Information identified as archived is provided for reference, research or recordkeeping purposes. It is not subject to the Government of Canada Web Standards and has not been altered or updated since it was archived. Please contact us to request a format other than those available.

Tables
- Table 26 Employment, by industry group
- Table 27 Gross domestic product at basic prices, by sector
- Table 28 Retail trade, sales by trade group
- Table 29 New motor vehicle sales in Canada
- Table 30 Manufacturing industries
- Table 31 Consumer Price Index and major components
- Table 32 Capital expenditures on construction
- Table 33 Oil and gas marketable production
Charts
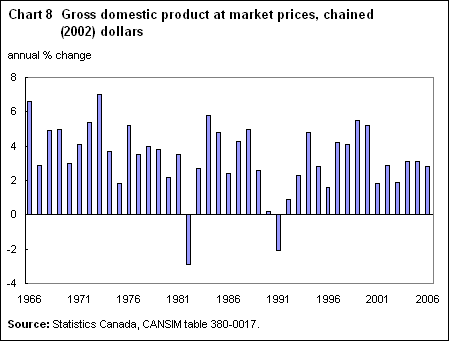
- Chart 8 Gross domestic product at market prices, chained
(2002) dollars
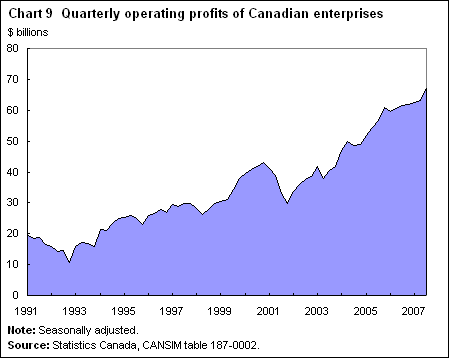
- Chart 9 Quarterly operating profits of Canadian enterprises
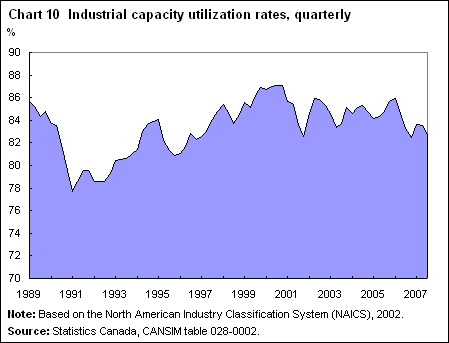
- Chart 10 Industrial capacity utilization rates, quarterly
Tables
Table 26 Employment, by industry group
| |
thousands of workers |
| All
industries |
13,706.0 |
15,310.4 |
16,866.4 |
| Goods-producing
sector |
3,561.0 |
3,878.6 |
3,993.0 |
| Agriculture |
417.0 |
325.4 |
337.2 |
| Forestry,
fishing, mining, oil and gas |
296.7 |
270.3 |
339.3 |
| Utilities |
115.3 |
131.9 |
138.0 |
| Construction |
721.0 |
865.2 |
1,133.5 |
| Manufacturing |
2,010.9 |
2,285.9 |
2,044.9 |
| Services-producing
sector |
10,145.1 |
11,431.8 |
12,873.5 |
| Trade |
2,106.1 |
2,409.3 |
2,682.4 |
| Transportation
and warehousing |
694.6 |
760.7 |
822.8 |
| Finance,
insurance, real estate and leasing |
865.0 |
895.1 |
1,060.4 |
| Professional,
scientific and technical services |
777.8 |
987.1 |
1,136.9 |
| Business,
building and other support services |
441.8 |
579.6 |
702.1 |
| Educational
services |
916.6 |
1,007.4 |
1,183.2 |
| Health
care and social assistance |
1,388.4 |
1,617.3 |
1,846.1 |
| Information,
culture and recreation |
603.5 |
715.1 |
782.0 |
| Accommodation
and food services |
871.0 |
985.1 |
1,069.4 |
| Public
administration |
797.2 |
788.9 |
864.6 |
| Other
services |
683.0 |
686.2 |
723.5 |
Table 27 Gross domestic product at basic prices, by industry
| |
millions of chained
(2002) dollars |
| All industries |
922,584 |
1,068,765 |
1,193,905 |
| Agriculture,
forestry, fishing and hunting |
24,471 |
23,293 |
27,847 |
| Mining
and oil and gas extraction |
49,991 |
53,488 |
57,174 |
| Utilities |
28,554 |
28,883 |
30,128 |
| Construction |
46,929 |
57,775 |
74,087 |
| Manufacturing |
158,819 |
182,736 |
186,631 |
| Wholesale
trade |
46,221 |
55,226 |
68,383 |
| Retail
trade |
47,210 |
58,483 |
69,015 |
| Transportation
and warehousing |
43,905 |
50,066 |
55,501 |
| Information
and cultural industries |
28,255 |
38,229 |
43,147 |
| Finance
and insurance |
55,749 |
63,630 |
73,872 |
| Real
estate and rental and leasing |
112,258 |
131,410 |
148,027 |
| Professional,
scientific and technical services |
38,056 |
48,481 |
55,377 |
| Administrative
and support, waste management and remediation services |
18,771 |
24,853 |
30,524 |
| Educational
services |
49,000 |
51,593 |
56,221 |
| Health
care and social assistance |
61,765 |
68,142 |
74,780 |
| Arts,
entertainment and recreation |
8,928 |
10,398 |
11,410 |
| Accommodation
and food services |
22,931 |
25,408 |
27,365 |
| Public
administration |
54,909 |
61,523 |
66,758 |
| Other
services |
21,886 |
27,230 |
30,072 |
Table 28 Retail trade, sales by trade group
| |
$ millions |
| All retail
trade groups |
246,818 |
319,525 |
412,207 |
| New
car dealers |
52,879 |
69,161 |
77,197 |
| Used
and recreational motor vehicle and parts dealers |
10,722 |
14,303 |
18,782 |
| Gasoline
stations |
20,380 |
28,138 |
46,085 |
| Furniture
stores |
5,277 |
7,467 |
10,131 |
| Home
furnishings stores |
2,428 |
3,701 |
5,989 |
| Computer
and software stores |
1,789 |
1,968 |
1,418 |
| Home
electronics and appliance stores |
5,330 |
8,361 |
12,324 |
| Home
centres and hardware stores |
8,765 |
12,517 |
21,541 |
| Specialized
building materials and garden stores |
3,415 |
4,234 |
5,085 |
| Supermarkets |
45,293 |
54,344 |
65,292 |
| Convenience
and specialty food stores |
6,907 |
7,694 |
10,124 |
| Beer,
wine and liquor stores |
9,223 |
12,697 |
16,036 |
| Pharmacies
and personal care stores |
16,106 |
20,410 |
28,358 |
| Clothing
stores |
11,710 |
14,220 |
18,254 |
| Shoe,
clothing accessories and jewellery stores |
4,076 |
4,926 |
5,586 |
| General
merchandise stores |
29,694 |
38,420 |
48,624 |
| Sporting
goods, hobby, music and book stores |
6,640 |
8,501 |
10,613 |
| Miscellaneous
store retailers |
6,185 |
8,463 |
10,770 |
Table 29 New motor vehicle sales in Canada
| |
units |
| Total |
1,533,637 |
1,424,380 |
1,690,548 |
| Manufactured
in North America |
1,118,119 |
1,257,702 |
1,278,920 |
| Manufactured
overseas |
415,518 |
166,678 |
411,628 |
Table 30 Manufacturing industries
| |
$ millions |
| Sales |
426,519 |
559,903 |
612,879 |
| New
orders |
436,719 |
555,920 |
626,861 |
| Annual
average |
|
|
|
| Month-end
inventory |
47,762 |
63,745 |
66,025 |
| Month-end
unfilled orders |
34,879 |
45,117 |
53,262 |
| |
ratio |
| Total
inventory to sales |
1.35 |
1.37 |
1.30 |
Table 31 Consumer Price Index and major components
| |
10-year average % change |
| All-items |
6.4 |
7.4 |
2.8 |
2.1 |
| Food |
7.3 |
7.9 |
2.2 |
2.3 |
| Shelter |
.. |
.. |
2.6 |
2.6 |
| Electricity |
7.9 |
7.4 |
4.1 |
2.4 |
| Water |
.. |
7.4 |
5.9 |
4.2 |
| Natural
gas |
7.6 |
9.7 |
1.4 |
8.1 |
| Fuel
oil and other fuel |
11.4 |
11.5 |
3.7 |
8.3 |
| Household
operations and furnishings |
.. |
.. |
2.0 |
1.0 |
| Clothing
and footwear |
4.5 |
5.4 |
2.5 |
-0.2 |
| Transportation |
6.0 |
8.2 |
3.6 |
2.6 |
| Gasoline |
7.1 |
10.4 |
2.3 |
5.9 |
| Health
and personal care |
6.1 |
7.1 |
2.9 |
1.6 |
| Recreation,
education and reading |
5.5 |
6.3 |
3.6 |
1.1 |
| Alcoholic
beverages and tobacco products |
5.3 |
10.4 |
3.9 |
5.8 |
Table 32 Capital expenditures on construction
| |
$ millions |
| Total
building construction |
82,436.9 |
99,489.4 |
116,466.4 |
| Total
residential building construction |
55,335.3 |
69,615.5 |
81,708.8 |
| Single
detached houses |
19,219.2 |
23,247.3 |
25,519.4 |
| Semi-detached
houses |
1,578.4 |
1,800.0 |
1,924.8 |
| Apartments
and row houses |
6,562.0 |
10,045.4 |
12,444.1 |
| Other
residential buildings |
27,975.6 |
34,522.8 |
41,820.6 |
| Total
non-residential building construction |
27,101.6 |
29,873.9 |
34,757.6 |
| Industrial
building construction |
4,206.0 |
3,950.8 |
4,080.2 |
| Commercial
building construction |
14,058.1 |
16,917.7 |
19,534.1 |
| Institutional
building construction |
8,837.6 |
9,005.4 |
11,143.2 |
| Total
engineering construction |
42,838.7 |
53,469.9 |
79,212.1 |
Table 33 Oil and gas marketable production
| Crude oil and
equivalent |
|
|
|
| Volume (thousands
of m3) |
117,620.5 |
128,951.0 |
154,099.1 |
| Value
($ millions) |
19,071.7 |
24,912.0 |
54,454.0 |
| Natural
gas |
|
|
|
| Volume
(millions of m3) |
153,578.3 |
171,350.6 |
171,690.0 |
| Value
($ millions) |
8,734.9 |
33,670.2 |
42,634.5 |
| Natural
gas by-products |
|
|
|
| Volume
(thousands of m3) |
26,656.0 |
29,353.4 |
32,084.6 |
| Value
($ millions) |
2,838.7 |
4,579.0 |
7,953.9 |
Charts
View data source
View data source
View data source